Are you looking for LGBTQ travel statistics or facts and trends?
Well, by studying LGBTQ travel statistics for the past three decades, CMI provides some of the key findings of this community and its traveling trends. Of course, CMI isn’t the only organization to look at LGBTQ travel statistics, but they offer some of the most comprehensive findings.
So, what are the most common LGBTQ travel statistics? In the list below you can find the key facts and statistics about LGBTQ:
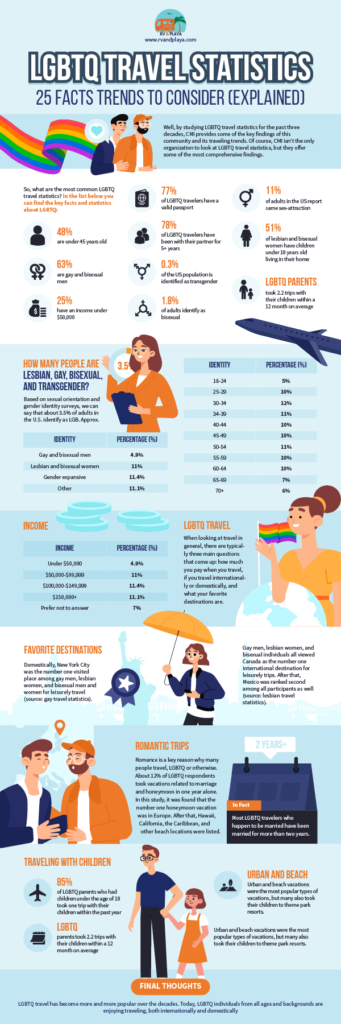
- 48% are under 45 years old
- 63% are gay and bisexual men
- 25% have an income under $50,000
- 77% of LGBTQ travelers have a valid passport
- 78% of LGBTQ travelers have been with their partner for 5+ years
- 51% of lesbian and bisexual women have children under 18 years old living in their home
- LGBTQ parents took 2.2 trips with their children within a 12 month on average
- 0.3% of the US population is identified as transgender
- 1.8% of adults identify as bisexual
- 11% of adults in the US report same sex-attraction
In this article, we are going to look at all the facts you need to know about LGBTQ statistics. Most of our statistics are taken from the Annual LGBTQ Tourism and Hospitality survey put out by CMI, but we also look at other reports and stats too.
Table of Contents
How Many People are Lesbian, Gay, Bisexual, and Transgender?
So, how Many People are Lesbian, Gay, Bisexual, and Transgender? Based on sexual orientation and gender identity surveys, we can say that about 3.5% of adults in the U.S. identify as LGB. Approx. 1.8% of adults identify as bisexual, 3.4% of women identify as lesbian or bisexual and around 0.3% identify as transgender.
Demographics
| Identity | Percentage (%) |
|---|---|
| Gay and bisexual men | 63% |
| Lesbian and bisexual women | 31% |
| Gender expansive | 8% |
| Other | 1% |
Age
| Age | Percentage (%) |
|---|---|
| 18-24 | 5% |
| 25-29 | 10% |
| 30-34 | 12% |
| 34-39 | 11% |
| 40-44 | 10% |
| 45-49 | 10% |
| 50-54 | 11% |
| 55-59 | 10% |
| 60-64 | 10% |
| 65-69 | 7% |
| 70+ | 6% |
👉 Of these respondents, the biggest age group to respond were between the ages of 30 to 34, who accounted for about 12% of responses.
👉 The age group with the least number of respondents was between the ages of 18 and 24. Only 5% of respondents were this age.
👉 The vast majority of the other age groups were evenly dispersed. The age groups between 25 to 29, 40 to 44, 45 to 49, 55 to 59, and 60 to 64 each attributed 10% of responses, leading to 50% of responses overall.
👉 Those aged 35 to 39 and 50 to 54 both had 11%, resulting in 22% total. 7% of the respondents were aged 65 to 69, whereas 6% were over 70.
Read also: Travel Statistics By Gender: 19 Facts Trends To Consider (Explained)
Income
| Income | Percentage (%) |
|---|---|
| Under $50,000 | 25% |
| $50,000-$99,999 | 30% |
| $100,000-$149,999 | 18% |
| $150,000+ | 21% |
| Prefer not to answer | 7% |
👉 Income was another factor looked at. 30% of the respondents fell between the $50,000 and $99,999 bracket.
👉 After that, 25% of the respondents made under $50,000 a year. 21% made over $150,000, whereas 18% made between $100,000 and $149,999.
👉 The last 7% preferred not to answer.
Relationship Status
| Relationship Status | Percentage (%) |
|---|---|
| Single | 31% |
| Married | 34% |
| In a relationship and living with partner | 15% |
| In a relationship and not living with partner | 10% |
| Engaged | 3% |
| Civil union or domestic partner | 2% |
👉 The last factor related to demographics was relationship status. The biggest portion of respondents was married, attributing to 34%.
👉 31% were single. Similarly, 15% of respondents were in a relationship and living with a partner, whereas 10% were in a relationship but not living with the partner.
👉 3% were engaged, and the remaining 2% were in a civil union or domestic partnership.

LGBTQ Travel
When looking at travel in general, there are typically three main questions that come up: how much you pay when you travel, if you travel internationally or domestically, and what your favorite destinations are.
These three questions apply to LGBTQ travelers as well.
Price
When looking at prices, the vast majority of LGBTQ participants classify as being a moderate price traveler with a little bit of luxury thrown in.
👉 About 32% of LGBTQ travelers fall under this category.
👉 Only 4% of LGBTQ travelers consider themselves luxury travelers.
International vs Domestic Travel
- 77% of LGBTQ travelers have a valid passport
- Only 36% of the US general population has a valid passport
As a whole, American LGBTQ travelers tend to be more active on the international scene than other Americans.
👉 In fact, 77% of the participants have a valid passport. To put that in perspective, only 36% of the US general population can say the same.
👉 Among the 77% who have an active passport, 53% used that passport to travel to another country within the last year.
For those who traveled internationally, safety as a foreigner and anti-LGBTQ laws were tied at 66% as being the biggest concern for international travel.
Favorite Destinations
Domestically, New York City was the number one visited place among gay men, lesbian women, and bisexual men and women for leisurely travel (source: gay travel statistics).
Similarly, New York City and Washington DC were the top locations for LGBTQ business travel.
Gay men, lesbian women, and bisexual individuals all viewed Canada as the number one international destination for leisurely trips. After that, Mexico was ranked second among all participants as well (source: lesbian travel statistics).
Number of Trips
- LGBTQ participants take 3.2 vacations on average
- LGBTQ participants take 1.4 business trips on average
- LGBTQ participants take 2.3 trips to visit family on average
👉 On average, LGBTQ participants had 3.2 vacation trips and 1.4 business trips within a 12 month period. These participants also took around 2.3 trips to visit their friends and families within the same 12-month span.
👉 In terms of leisure trips and vacations, 19% took two a year. Shockingly, 18% of respondents took six or more trips a year.
👉 On the other end of the spectrum, 13% of LGBTQ respondents did not go on any leisurely trips over a 12 month period.
👉 In terms of vacations for the purpose of visiting friends or family, 24% took one trip.
👉 The second most common number of trips for visiting friends or family was zero, which attributed to 22% of the respondents.
👉 The last reason for travel is business. The majority of LGBTQ respondents did not travel at all for business purposes. 56% of respondents fell under this category.
👉 16%, in contrast, took one trip related to business within the last 12 months.
Read also: Demographics of Full-time RVers: 13 Facts You Should Know (Explained)
Romantic Trips
- 12% of newlywed LGBTQ participants took a romantic vacation over the last year
- 25% of newlyweds visited Europe for their honeymoon
Romance is a key reason why many people travel, LGBTQ or otherwise. About 12% of LGBTQ respondents took vacations related to marriage and honeymoon in one year alone.
In this study, it was found that the number one honeymoon vacation was in Europe. After that, Hawaii, California, the Caribbean, and other beach locations were listed.
Most LGBTQ travelers who happen to be married have been married for more than two years.
👉 In fact, 73% of the married respondents said that they have been married for more than two years but still travel together.
Married and Non-Married Couples
- 78% of LGBTQ travelers have been with their partner for 5+ years
👉 Still, not all couples are married. 78% of partnered LGBTQ participants have actually been with their partner or spouse for over 5 years.
Many of these couples list their number one reason for taking a romantic trip was to just have fun with their partner.
After that, becoming more romantically connected with the partner, to get out of a rut, or to intellectually connect with the partner was listed as other important reasons for traveling with their partner or spouse.
Age and Romantic Trips
Age seemed to be a huge factor for how long respondents had been with their partners. For LGBTQ respondents who traveled with their partners, the vast majority had been together for 10 years or more.
👉 17% of Millennials, 53% of Gen X, and 79% of Boomers had been with their partners for 10 years when traveling with them the past year.
The shorter the couples had been together, the less likely they were to travel together. For example, Millennials who had been together for 5 to 9 years attributed to 43% of respondents, whereas Millennial couples who had been together for one to four years attributed to 37% of responses.
👉 Only 3% of Millennial couples have been together for less than one year when traveling together.
The same trend correlates with both Generation X and Boomers as well. Interestingly, even fewer percent of respondents from older generations who had been partnered for shorter periods of time traveled together.
This might be because those of older generations tend to be partners more long-term than the younger generations.

Family Travel
- 51% of lesbian and bisexual women have children under 18 years old living in their home
- 8% of gay and bisexual men have children under 18 years old living in their home
In addition to romance trips, family travel is another highly important tourist industry for both LGBTQ and non-LGBTQ individuals. Generation X and Millennial women are the two groups most likely to have children living in their households.
It is these respondents who most likely classify as traveling with a family.
Gay and bisexual men had very low numbers of children under the age of 18 living with them.
👉 In fact, only 8% of gay and bisexual men respondents fall under this category, and this includes Millennials, Generation X, and Boomers.
👉 In comparison, 13% of Millennial, 32% of Generation X, and 6% of Boomer lesbian and bisexual women have a child under the age of 18 living in their house.
👉 Whenever LGBTQ individuals partake in family travel, the vast majority look for child-friendly vacation destinations and accommodations. For vacation destinations specifically, 61% look for child-friendly locations, and 39% look for LGBTQ-friendly locations.
👉 Similarly, 64% of respondents look for child-friendly hotels or accommodations, and only 36% look for LGBTQ-friendly accommodations.
Traveling with Children
- 85% of LGBTQ parents who had children under the age of 18 took one trip with their children within the past year
- LGBTQ parents took 2.2 trips with their children within a 12 month on average
👉 Around 85% of LGBTQ parents who had children under the age of 18 took one trip with their family over the past year.
Urban and beach vacations were the most popular types of vacations, but many also took their children to theme park resorts.
👉 On average, LGBTQ parents took 2.2 trips with their children within a 12 month period. A whopping 13% took five or more trips, whereas 15% took 0.
👉 As far as overnight vacations with children go, 55% of LGBTQ parents took their children to some sort of urban or city vacation.
👉 55% of parents also traveled with their children to visit other friends and family members. Just under that, 54% of respondents took their children to some sort of beach vacation.
Traveling with Grandchildren
- 14% of LGBTQ Baby Boomers have grandchildren
- 29% of LGBTQ Baby Boomers with grandchildren took their grandchildren on a vacation within the past year
👉 There are many LGBTQ multi-generational families as well. About 14% of LGBTQ Baby Boomers have grandchildren, and 29% of those individuals took their grandchildren on a vacation within the past year.
👉 More specifically, 17% of Baby Boomer lesbians and bi women have grandchildren, whereas 9% of Baby Boomer gay and bi men have grandchildren.
Final Thoughts
LGBTQ travel has become more and more popular over the decades. Today, LGBTQ individuals from all ages and backgrounds are enjoying traveling, both internationally and domestically.
It even seems that the LGBT community seems to lead the way in terms of international trips in the US.
References
https://communitymarketinginc.com/lgbtq-tourism/
https://www.statista.com/statistics/1072690/travel-spending-lgbtq-travelers/
Recent Posts
Solo Travel Statistics: 13 Facts Trends To Consider (Explained)
Looking for travel statistics or trends? Traveling has long been a popular pastime among all groups and demographics around the world. Whether it is taking a relaxing vacation at the beach or...
Travel Statistics By Age Group: 17 Facts Trends To Know (Explained)
Looking for travel statistics by age group? Traveling is something that just about everyone, regardless of their age, loves to do. Despite the common attraction of traveling, the statistics show...